The General Administration of Customs today released the foreign trade import and export situation in the first five months of this year. According to customs statistics, in the first five months of this year, China’s total import and export value was 10.3 trillion yuan, down 2.2% from the same period last year. Among them, exports were 5.4 trillion yuan, down 2.7%; Imports were 4.9 trillion yuan, down 1.6%; The trade surplus was 436.6 billion yuan, narrowing by 13.6%. In May, China’s total import and export value was 2.18 trillion yuan, which changed from 3.1% in the previous four months to 1.5%. Among them, the export was 1.2 trillion yuan, which was reduced by 4.8% in the first four months and increased by 5.4%. Imports were 0.98 trillion yuan, down 2.9%; The trade surplus was 220.4 billion yuan, an increase of 70.3% (below).
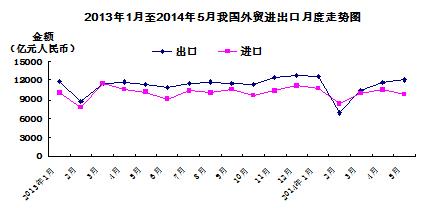
In dollar terms, in the first five months, China’s total import and export value was $1,679.1 billion, an increase of 0.2%. Among them, exports were 875.2 billion US dollars, down by 0.4%; Imports reached US$ 803.9 billion, up by 0.8%; The trade surplus was $71.3 billion, narrowing by 12.2%.
In May, China’s total import and export value was $355.02 billion, an increase of 3%. Among them, exports reached 195.47 billion US dollars, up by 7%; Imports reached US$ 159.55 billion, down 1.6%; The trade surplus was $35.92 billion, an increase of 74.9%.
In the first five months of this year, China’s foreign trade import and export mainly showed the following characteristics:
The import and export of general trade maintained growth, while the import and export of processing trade declined. In the first five months, China’s general trade import and export was 5.66 trillion yuan, up 5.1%, accounting for 55% of China’s total foreign trade, up 3.8 percentage points from the same period last year. Among them, exports were 2.76 trillion yuan, up 5.7%, accounting for 51.5% of the total export value; Imports reached 2.9 trillion yuan, up 4.5%, accounting for 58.9% of the total import value. The deficit under general trade was 141.46 billion yuan, narrowing by 14.4%. In the same period, the import and export of China’s processing trade was 3.25 trillion yuan, down 5.3%, accounting for 31.6% of China’s total foreign trade, down 1 percentage point from the same period last year. Among them, exports were 2.05 trillion yuan, down 4.8%, accounting for 38.3% of the total export value; Imports were 1.2 trillion yuan, down 6.1%, accounting for 24.3% of the total import value. The surplus under processing trade was 859.1 billion yuan, narrowing by 2.9%.
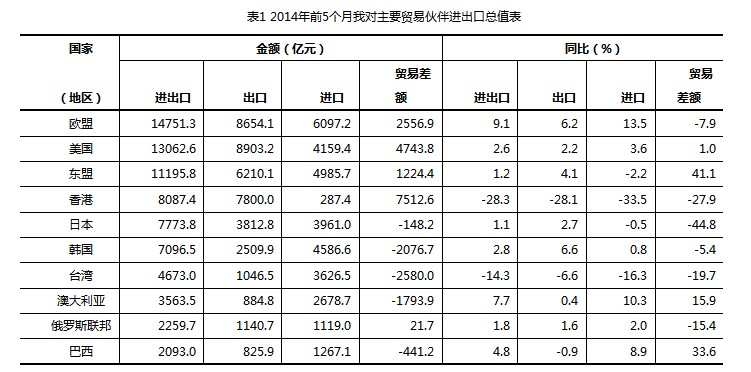
Imports and exports to the European Union, the United States, ASEAN and Japan maintained growth, while trade with Hong Kong declined. In the first five months, China-EU bilateral trade totaled 1.48 trillion yuan, an increase of 9.1%. The total bilateral trade between China and the United States was 1.31 trillion yuan, an increase of 2.6%. In the first five months, the total bilateral trade between China and ASEAN was 1.12 trillion yuan, an increase of 1.2%. The total value of bilateral trade between China and Japan was 777.38 billion yuan, up by 1.1%. In the first five months, the total value of bilateral trade between the Mainland and Hong Kong was 808.74 billion yuan, down by 28.3% (Table 1).
The proportion of total imports and exports in seven provinces and cities, such as Guangdong and Jiangsu, declined, and exports in the central and western regions were active. In the first five months, Guangdong’s total import and export value was 2.4 trillion yuan, down 19.7%, accounting for 23.3% of the country’s total import and export value. In the same period, the total import and export value of Jiangsu and Shanghai was 1.39 trillion and 1.15 trillion respectively, up by 3.6% and 6.1% respectively. The total import and export value of Beijing (including central units in Beijing) was 1.1 trillion yuan, down by 0.7%. In addition, the total import and export value of Zhejiang was 848.05 billion yuan, an increase of 3.6%; Shandong was 700.56 billion yuan, an increase of 7.6%; Fujian was 418.26 billion yuan, down 3.4%. The total import and export value of the above seven provinces and cities accounted for 77.8% of the total import and export value of the country, down 2.3 percentage points from the same period last year.
In terms of exports, in the first five months, Guangdong exported 1.4 trillion yuan, down 16.9%. Jiangsu exported 822.24 billion yuan, an increase of 2.5%; Zhejiang 628.45 billion yuan, an increase of 5.6%; Shanghai 508.69 billion yuan, an increase of 0.7%; Shandong 338.25 billion yuan, an increase of 5.1%; Fujian 260.66 billion yuan, down 3.7%; Beijing 153.92 billion yuan, down 2%. Exports from the central and western regions maintained rapid growth, with the export growth rates of some central and western provinces such as Yunnan, Shaanxi, Gansu, Chongqing and Guangxi being 52.6%, 46.8%, 42.4%, 41.9% and 41% respectively.
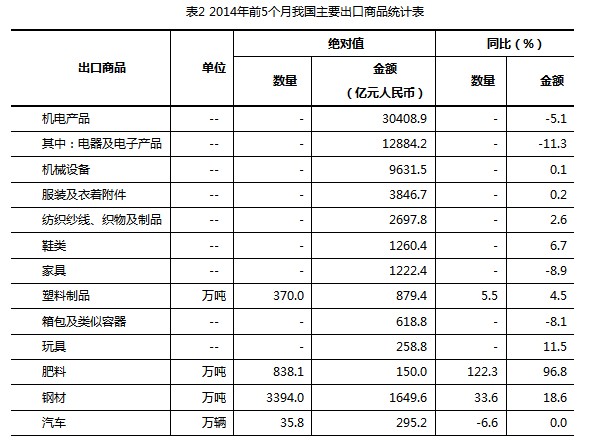
Among the export commodities, the export of mechanical and electrical products declined, while the export of traditional labor-intensive products increased against the trend. In the first five months, the export of mechanical and electrical products in China was 3.04 trillion yuan, down 5.1%, accounting for 56.7% of the total export value. Among them, the export of electrical and electronic products was 1.29 trillion yuan, down 11.3%; Mechanical equipment was 963.15 billion yuan, an increase of 0.1%. In the same period, clothing exports reached 384.67 billion yuan, an increase of 0.2%; Textiles reached 269.78 billion yuan, an increase of 2.6%; Footwear was 126.04 billion yuan, an increase of 6.7%; Furniture was 122.24 billion yuan, down 8.9%; Plastic products reached 87.94 billion yuan, an increase of 4.5%; Luggage was 61.88 billion yuan, down 8.1%; Toys were 25.88 billion yuan, up by 11.5%; The total export of the above-mentioned seven categories of labor-intensive products was 108 million yuan, which reversed from a decrease of 0.8% in the first four months to an increase of 0.4%, accounting for 20.1% of the total export value. In addition, fertilizer exports reached 8.381 million tons, an increase of 1.2 times; 33.94 million tons of steel, an increase of 33.6%; There were 358,000 automobiles, a decrease of 6.6% (Table 2).
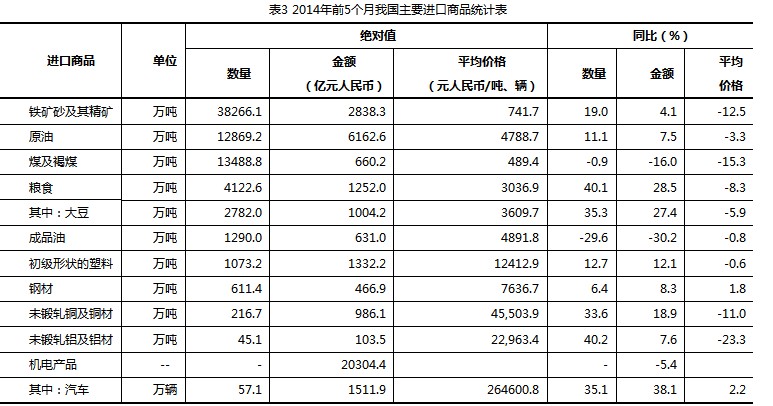
Among the imported commodities, the import volume of major commodities increased, and the average import price generally fell. In the first five months, China imported 380 million tons of iron ore, up 19%, and the average import price was 741.7 yuan per ton, down 12.5%. Crude oil was 130 million tons, up 11.1%, and the average import price was 4,788.7 yuan per ton, down 3.3%. Grain was 41.226 million tons, an increase of 40.1%; Among them, soybean was 27.82 million tons, up 35.3%, and the average import price was 3,609.7 yuan per ton, down 5.9%. Primary plastic was 10.732 million tons, up 12.7%, and the average import price was 12,400 yuan per ton, down 0.6%. The unwrought copper and copper products were 2.167 million tons, up by 33.6%, and the average import price was 45,500 yuan per ton, down by 11%. There were 451,000 tons of unwrought aluminum and aluminum products, up by 40.2%, and the average import price was 23,000 yuan per ton, down by 23.3%.
In addition, imported coal was 130 million tons, down by 0.9%, and the average import price was 489.4 yuan per ton, down by 15.3%; Refined oil was 12.9 million tons, down 29.6%, and the average import price was 4,891.8 yuan per ton, down 0.8%. Steel was 6.114 million tons, up 6.4%, and the average import price was 7636.7 yuan per ton, up 1.8%. The import of mechanical and electrical products was 2.03 trillion yuan, down 5.4%; Among them, there were 571,000 automobiles, an increase of 35.1% (Table 3).
China’s foreign trade export leading index has further strengthened. In May this year, China’s foreign trade export leading index was 42.3, 0.4 higher than that in April, which has been rising for three consecutive months, indicating that China’s exports will continue to improve in the next 2-3 months.
With the approval of the State Council, since the release of customs statistics in 2014, statistics denominated in RMB have been adopted in an all-round way.
关于作者